
Data Cleaning: Consumer Complaint Database
Introduction
Here, I will clean data from the Financial Services Consumer Complaint Database which is publicly available in this link. As described in this webpage, it contains “data from the complaints received by the Consumer Financial Protection Bureau (CFPB) on financial products and services, including bank accounts, credit cards, credit reporting, debt collection, money transfers, mortgages, student loans, and other types of consumer credit. Data available about each complaint includes the name of the provider, type of complaint, date, zip code, and other information.”
Data cleaning
Import the libraries to set up the envirenment and load the data
import pandas as pd
import numpy as np
import os
# Load the raw data using the read_csv object
df = pd.read_csv("/Users/hossein/Consumer_Complaints/Consumer_Complaints.csv")
Investigate the data
Pandas provides enough tools to get information about your raw data by just a brief line of code. Let’s look at the top of our dataset by executing the following command:
df.head()
| Date received | Product | Sub-product | Issue | Sub-issue | Consumer complaint narrative | Company public response | Company | State | ZIP code | Tags | Consumer consent provided? | Submitted via | Date sent to company | Company response to consumer | Timely response? | Consumer disputed? | Complaint ID | |
|---|---|---|---|---|---|---|---|---|---|---|---|---|---|---|---|---|---|---|
| 0 | 02/04/2019 | Credit card or prepaid card | General-purpose credit card or charge card | Getting a credit card | Sent card you never applied for | NaN | Company believes it acted appropriately as aut... | First Federal Credit Control | FL | NaN | NaN | NaN | Web | 02/04/2019 | Closed with explanation | Yes | NaN | 3141563 |
| 1 | 02/04/2019 | Debt collection | Payday loan debt | False statements or representation | Attempted to collect wrong amount | NaN | NaN | ONEMAIN FINANCIAL HOLDINGS, LLC. | MI | NaN | Older American | NaN | Web | 02/04/2019 | In progress | Yes | NaN | 3141667 |
| 2 | 02/04/2019 | Credit reporting, credit repair services, or o... | Credit reporting | Incorrect information on your report | Information belongs to someone else | NaN | NaN | NCC Business Services, Inc. | TX | NaN | NaN | NaN | Web | 02/04/2019 | In progress | Yes | NaN | 3142226 |
| 3 | 02/04/2019 | Mortgage | Conventional home mortgage | Struggling to pay mortgage | NaN | NaN | NaN | BAYVIEW LOAN SERVICING, LLC | CA | NaN | NaN | Other | Web | 02/04/2019 | In progress | Yes | NaN | 3142610 |
| 4 | 02/04/2019 | Debt collection | I do not know | Attempts to collect debt not owed | Debt was paid | NaN | NaN | Diversified Consultants, Inc. | OH | 45044 | NaN | NaN | Web | 02/04/2019 | In progress | Yes | NaN | 3141862 |
A quick look at this dataset, we can see that in some of our columns, we have NaN values. I will get back to this but first let’s get some information about the structure of our data by executing df.dtypes and df.info().
df.shape
(1210607, 18)
df.dtypes.to_frame(name='Type') # df.info() is also return back data type plus other useful info.
| Type | |
|---|---|
| Date received | object |
| Product | object |
| Sub-product | object |
| Issue | object |
| Sub-issue | object |
| Consumer complaint narrative | object |
| Company public response | object |
| Company | object |
| State | object |
| ZIP code | object |
| Tags | object |
| Consumer consent provided? | object |
| Submitted via | object |
| Date sent to company | object |
| Company response to consumer | object |
| Timely response? | object |
| Consumer disputed? | object |
| Complaint ID | int64 |
Looking at the output of these two commands, we can see we have 18 columns (features) and over 1.2M rows. So this is a pretty huge dataset. Another important thing that we need to consider is understanding data types. A data type is essentially an inner construct that a programming language recruits to know how to store and manipulate data. Here we can see that all of our features are objects (strings), but the Complaint ID is an integer type. Later on, I will convert some of these data types to other ones as needed.
Ok, now let’s see how many missing (NAN) values we have in each column. The following command provides this information for us. It sounds like we have a significant number of missing values in 9 columns. I will fill them mostly by a “Not given” str type in the next section.
df.isnull().sum().to_frame(name='missing counts')
| missing counts | |
|---|---|
| Date received | 0 |
| Product | 0 |
| Sub-product | 235166 |
| Issue | 0 |
| Sub-issue | 521887 |
| Consumer complaint narrative | 846404 |
| Company public response | 797586 |
| Company | 0 |
| State | 17098 |
| ZIP code | 104875 |
| Tags | 1045378 |
| Consumer consent provided? | 564853 |
| Submitted via | 0 |
| Date sent to company | 0 |
| Company response to consumer | 6 |
| Timely response? | 0 |
| Consumer disputed? | 442087 |
| Complaint ID | 0 |
Clean up the data
Let’s start with “date columns”. We have two colums that we need to convert themfrom strings to datetime objects. Pandas to_datetime command can easyly do this job for us:
df["Date received"] = pd.to_datetime(df["Date received"])
df['Date sent to company'] = pd.to_datetime(df['Date sent to company'])
There are three columns in our dataset that can be considered as Boolean type. The following three lines of commands will execute this conversion by recruiting Numpy’s “where” module. The idea is to convert all “Yes” values to True, and everything else will be assigned to False (in case of the third line, “Consent not provided” to False and the rest to True ).
The basic idea is to use the np.where() function to convert all “Y” values to True, and everything else assigned False.
df["Timely response?"] = np.where(df["Timely response?"] == "Yes", True, False)
df["Consumer disputed?"] = np.where(df["Consumer disputed?"] == "Yes", True, False)
df["Consumer consent provided?"] = np.where(df["Consumer consent provided?"] == "Consent not provided", False, True)
The “ZIP code” column contains lots of signs and also extra letters attached to some of the zip codes in this column. This function written below will strip all these out from the column.
def replace_ZIP_code_XX_USMOI(x):
    '''
    Replace XX in Zip code to 00
    '''
    try:
        return x.replace('XX', '00').replace('(','').replace('"','').replace('-','').replace('$','').replace('.','').replace('!','').replace('+','').replace('*','').replace('`','').replace('/','').replace('UNITED STATES MINOR OUTLYING ISLANDS','USMOI')
    except AttributeError:
        return np.NaN

df['ZIP code'] = df['ZIP code'].map(replace_ZIP_code_XX_USMOI)
df["State"] = df["State"].map(replace_ZIP_code_XX_USMOI)
Now Let’s fill in all the missing values with appropriate values.
In “ZIP code” case, I will fill them in with “00000” and convert its type to integer. For the other cases, I will fill them in with “Not given” string.
df['ZIP code'] = df['ZIP code'].fillna("00000").astype(int)
df['State'] = df['State'].fillna("Not given")
df['Product'] = df['Product'].fillna("Not given")
df['Sub-product'] = df['Sub-product'].fillna("Not given")
df['Issue'] = df['Issue'].fillna("Not given")
df['Sub-issue'] = df['Sub-issue'].fillna("Not given")
df['Consumer complaint narrative'] = df['Consumer complaint narrative'].fillna("Not given")
df['Company public response'] = df['Company public response'].fillna("Not given")
df['Company response to consumer'] = df['Company response to consumer'].fillna("Not given")
df['Tags'] = df['Tags'].fillna("Not given")
#lets see How our data types look like.
df.dtypes.to_frame(name='Type')
| Type | |
|---|---|
| Date received | datetime64[ns] |
| Product | object |
| Sub-product | object |
| Issue | object |
| Sub-issue | object |
| Consumer complaint narrative | object |
| Company public response | object |
| Company | object |
| State | object |
| ZIP code | int64 |
| Tags | object |
| Consumer consent provided? | bool |
| Submitted via | object |
| Date sent to company | datetime64[ns] |
| Company response to consumer | object |
| Timely response? | bool |
| Consumer disputed? | bool |
| Complaint ID | int64 |
Ok, now I will save the cleaned data set into the current working directory (%pwd or cwd) by the following command line.
df.to_csv("Customer_Complaints_cleaned.csv", sep='\t', encoding='utf-8') # cwd = os.getcwd()
Data vizualization
from IPython.display import display
pd.options.display.max_columns = None
import matplotlib.pyplot as plt
import seaborn as sns
sns.set()
import pylab as pl
from matplotlib import cm
import plotly.graph_objs as go
import plotly.offline as py
import os
import plotly.tools as tls
import plotly.figure_factory as ff
import matplotlib.ticker as mtick
%matplotlib inline
sb.set_style('whitegrid')
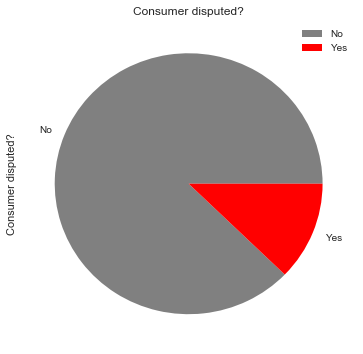
Disputed_cunsumer_rate = (df['Consumer disputed?'].value_counts()*100.0 /len(df)).plot(kind='pie',\
        labels = ['No', 'Yes'], figsize = (6,6) , colors = ['grey','red'])

Disputed_cunsumer_rate.set_title('Consumer disputed?')
Disputed_cunsumer_rate.legend(labels=['No','Yes']);
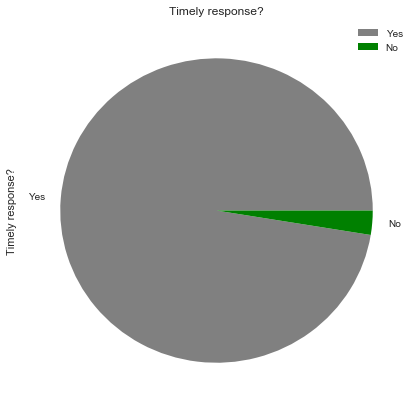
Timely_response_rate = (df['Timely response?'].value_counts()*100.0 /len(df)).plot(kind='pie',\
        labels = ['Yes', 'No'], figsize = (7,7) , colors = ['grey','green'])

Timely_response_rate.set_title('Timely response?')
Timely_response_rate.legend(labels=['Yes','No']);
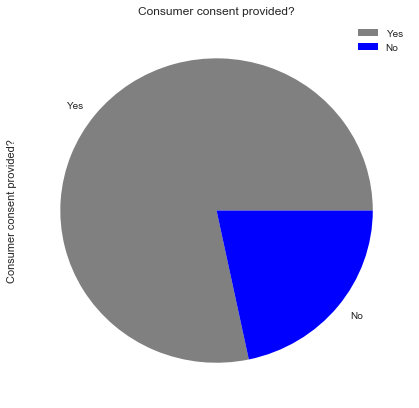
Consumer_consent_provided_rate = (df['Consumer consent provided?'].value_counts()*100.0 /len(df)).plot(kind='pie',\
        labels = ['Yes', 'No'], figsize = (7,7) , colors = ['grey','blue'])

Consumer_consent_provided_rate.set_title('Consumer consent provided?')
Consumer_consent_provided_rate.legend(labels=['Yes','No']);
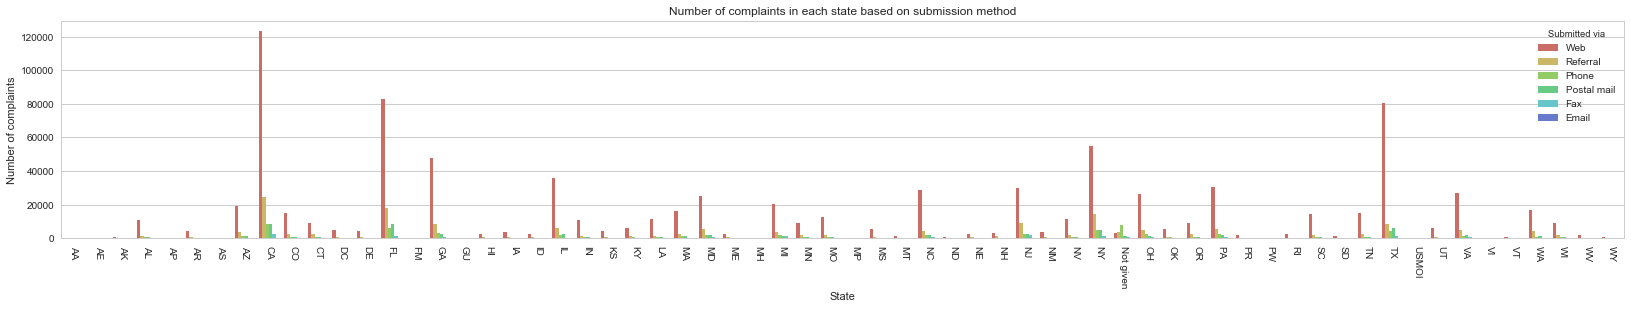
rcParams['figure.figsize'] = 28, 4
gb = df.groupby("State")["Submitted via"].value_counts().to_frame().rename({"Submitted via": "Number of complaints"}, axis = 1).reset_index()
sns.barplot(x = "State", y = "Number of complaints", data = gb, hue = "Submitted via", palette = sns.color_palette("hls", 8)).set_title("Number of complaints in each state based on submission method");
plt.xticks(rotation=-90);
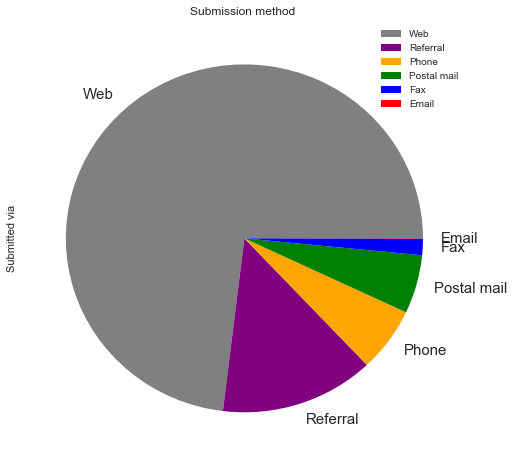
submission = (df['Submitted via'].value_counts()*100.0 /len(df)).plot(kind='pie',\
        figsize = (8,8) , colors = ['grey','purple', 'orange', 'green', 'blue', 'red'], fontsize = 15)

submission.set_title('Submission method ')
submission.legend(labels=['Web', 'Referral', 'Phone', 'Postal mail', 'Fax', 'Email']);
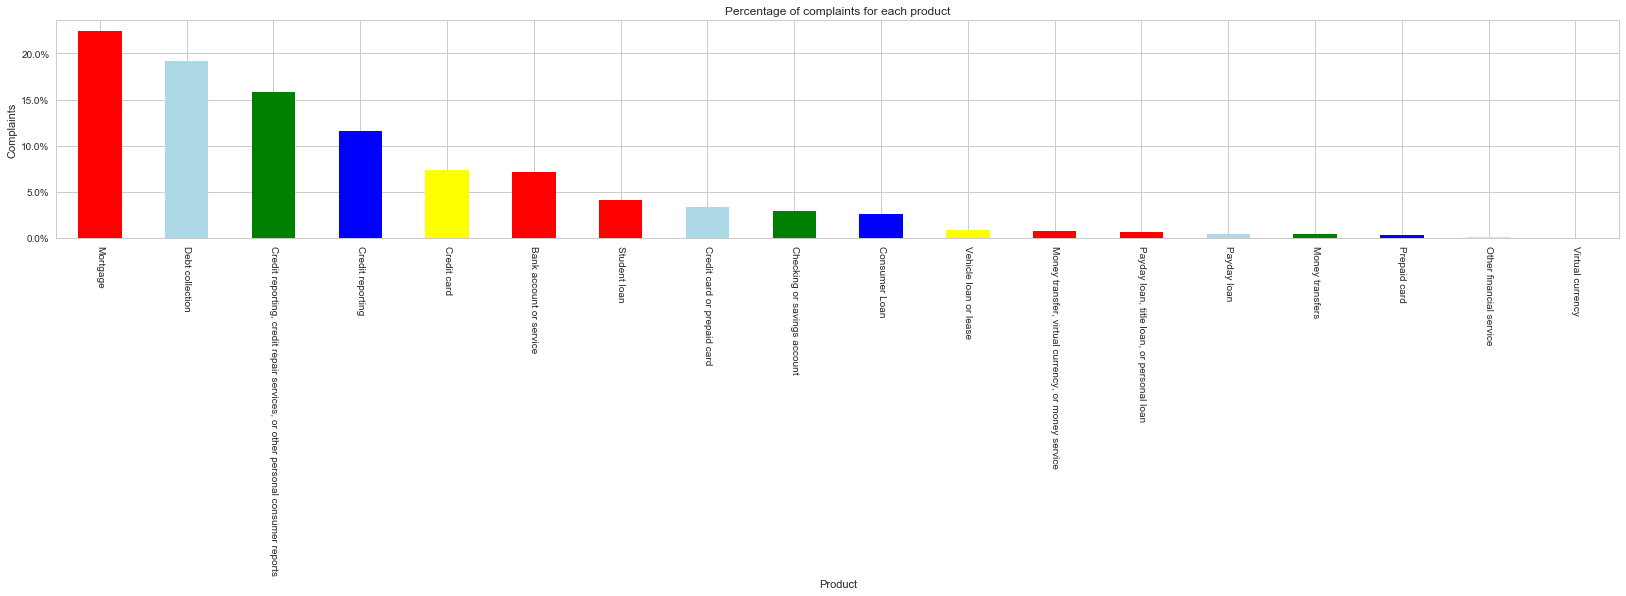
product_info = (df['Product'].value_counts()*100.0 /len(df2)).plot(kind='bar', stacked = True,\
                                                rot = 0, color = ['red','lightblue','green', 'blue', 'yellow'])

product_info.yaxis.set_major_formatter(mtick.PercentFormatter())
product_info.set_ylabel('Complaints')
product_info.set_xlabel('Product')
product_info.set_title('Percentage of complaints for each product');
plt.xticks(rotation=-90);
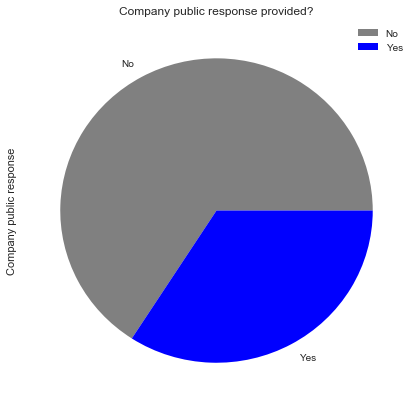
df["Company public response"] = np.where(df["Company public response"] == "Not given", False, True)
Company_public_response_rate = (df['Company public response'].value_counts()*100.0 /len(df2)).plot(kind='pie',\
        labels = ['No', 'Yes'], figsize = (7,7) , colors = ['grey','blue'])

Company_public_response_rate.set_title('Company public response provided?')
Company_public_response_rate.legend(labels=['No','Yes']);
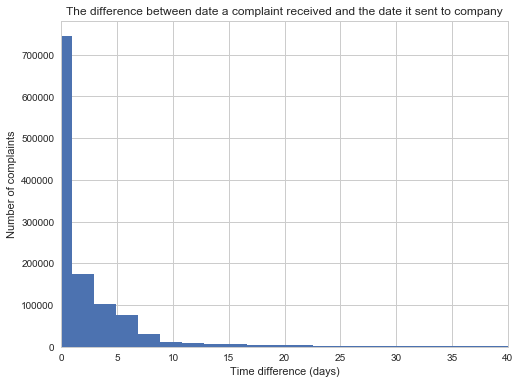
date_delay = (df['Date sent to company']- df['Date received']).astype('timedelta64[D]')
rcParams['figure.figsize'] = 8, 6
plt.hist(date_delay, normed=False, bins=1000)
plt.ylabel('Number of complaints');
plt.xlabel('Time difference (days)');
plt.title('The difference between date a complaint received and the date it sent to company')
plt.xlim((0, 40))