

Data Scraping from Clutch Company’s Website with Python
Clutch company’s Used Vehicles
Here, I will look at Clutch’s inventory of used vehicles. I will scrape the data from the Clutch’s website, clean them, and finally visulize the results.
Data Scaping
import pandas as pd
from requests import get
from bs4 import BeautifulSoup
import unicodedata
from unicodedata import normalize
I am going to use the BeautifulSoup library to parse the HTML content of this website.
url = '/Users/hossein/clutch.html'
with open(url) as html_file:
    html_soup = BeautifulSoup(html_file, 'html.parser')
The following data will be extraced for each car:
- Model
- Make
- Price
- Mileage
- Year
car_info_containers = html_soup.find_all('div', class_ = 'card_container vehicle-card_container card_container__clickable')
print(type(car_info_containers))
print(len(car_info_containers))
<class 'bs4.element.ResultSet'>
242
first_car_info = car_info_containers[0]
model_info = first_car_info.find('div', class_ = 'vehicle-card_content_model').text
model_info = normalize("NFKD", model_info)
model_info
'Ghibli Q4 '
make_info = first_car_info.find('div', class_ = 'vehicle-card_content_make').text
make_info
'Maserati'
price_info = first_car_info.find('div', class_ = 'vehicle-card_content_price').text
price_info
'$53,990'
year_mileage_info = first_car_info.find('div', class_ = 'vehicle-card_content_details_year-mileage').text
year_mileage_info
'2015\xa0•\xa070K\xa0km'
biweekly_info = first_car_info.find('div', class_ = 'vehicle-card_content_details_biweekly').text
biweekly_info
'$430\xa0Biweekly'
model = []
make = []
price = []
yearmileage = []
biweekly = []
for container in car_info_containers:
    model_info = container.find('div', class_ = 'vehicle-card_content_model').text
    model_info = normalize("NFKD", model_info) # to remove \xa0 from string
    model.append(model_info)
    make_info = container.find('div', class_ = 'vehicle-card_content_make').text
    make_info = normalize("NFKD", make_info)
    make.append(make_info)
    price_info = container.find('div', class_ = 'vehicle-card_content_price').text
    price_info = normalize("NFKD", price_info)
    price.append(price_info)
    year_mileage_info = container.find('div', class_ = 'vehicle-card_content_details_year-mileage').text
    year_mileage_info = normalize("NFKD", year_mileage_info)
    yearmileage.append(year_mileage_info)
    biweekly_info = container.find('div', class_ = 'vehicle-card_content_details_biweekly').text
    biweekly_info = normalize("NFKD", biweekly_info)
    biweekly.append(biweekly_info)
df = pd.DataFrame({'model': model,
                       'make': make,
                       'price': price,
                       'year_mileage': yearmileage,
                       'biweekly_rate': biweekly})

print(df.info())

df.head()
<class 'pandas.core.frame.DataFrame'>
RangeIndex: 242 entries, 0 to 241
Data columns (total 5 columns):
model            242 non-null object
make             242 non-null object
price            242 non-null object
year_mileage     242 non-null object
biweekly_rate    242 non-null object
dtypes: object(5)
memory usage: 9.5+ KB
None
| model | make | price | year_mileage | biweekly_rate | |
|---|---|---|---|---|---|
| 0 | Ghibli Q4 | Maserati | $53,990 | 2015 • 70K km | $430 Biweekly |
| 1 | Civic Si | Honda | $18,800 | 2014 • 45K km | $151 Biweekly |
| 2 | RAV4 XLE | Toyota | $19,950 | 2015 • 79K km | $161 Biweekly |
| 3 | Mazda3 GT Premium | Mazda | $23,850 | 2018 • 24K km | $191 Biweekly |
| 4 | Highlander LE | Toyota | $26,200 | 2015 • 68K km | $210 Biweekly |
Data Cleaning
dfcols = df.columns
df[dfcols] = df[dfcols].replace({'\$':'', 'Biweekly':'', '•':'', 'km':'', ',':''}, regex = True)
df['year_mileage'] = df['year_mileage'].replace({'K':''}, regex = True)
year_mileage = df["year_mileage"].str.split("  ", n = 1, expand = True)
df["year"]= year_mileage[0]
df["mileage"]= year_mileage[1]
df.drop(columns =["year_mileage"], inplace = True)

df.head()
| model | make | price | biweekly_rate | year | mileage | |
|---|---|---|---|---|---|---|
| 0 | Ghibli Q4 | Maserati | 53990 | 430 | 2015 | 70 |
| 1 | Civic Si | Honda | 18800 | 151 | 2014 | 45 |
| 2 | RAV4 XLE | Toyota | 19950 | 161 | 2015 | 79 |
| 3 | Mazda3 GT Premium | Mazda | 23850 | 191 | 2018 | 24 |
| 4 | Highlander LE | Toyota | 26200 | 210 | 2015 | 68 |
df['price'] = df['price'].astype(float)
df['biweekly_rate'] = df['biweekly_rate'].astype(float)
df['year'] = df['year'].astype(int)
df['mileage'] = df['mileage'].astype(int)*1000
df['model'] = df['model'].astype(str)
df['make'] = df['make'].astype(str)
df.head()
| model | make | price | biweekly_rate | year | mileage | |
|---|---|---|---|---|---|---|
| 0 | Ghibli Q4 | Maserati | 53990.0 | 430.0 | 2015 | 70000 |
| 1 | Civic Si | Honda | 18800.0 | 151.0 | 2014 | 45000 |
| 2 | RAV4 XLE | Toyota | 19950.0 | 161.0 | 2015 | 79000 |
| 3 | Mazda3 GT Premium | Mazda | 23850.0 | 191.0 | 2018 | 24000 |
| 4 | Highlander LE | Toyota | 26200.0 | 210.0 | 2015 | 68000 |
Data Visualization
from pandas.tools.plotting import scatter_matrix

import matplotlib.pyplot as plt
from pylab import rcParams
import seaborn as sb
%matplotlib inline
rcParams['figure.figsize'] = 5, 4
sb.set_style('whitegrid')
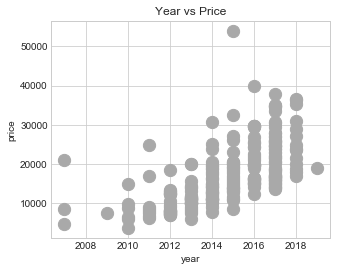
df.plot(kind='scatter', x='year', y='price', c=['darkgray'], s=150)

plt.xlabel('year')
plt.ylabel('price')
plt.title('Year vs Price')
Text(0.5,1,'Year vs Price')
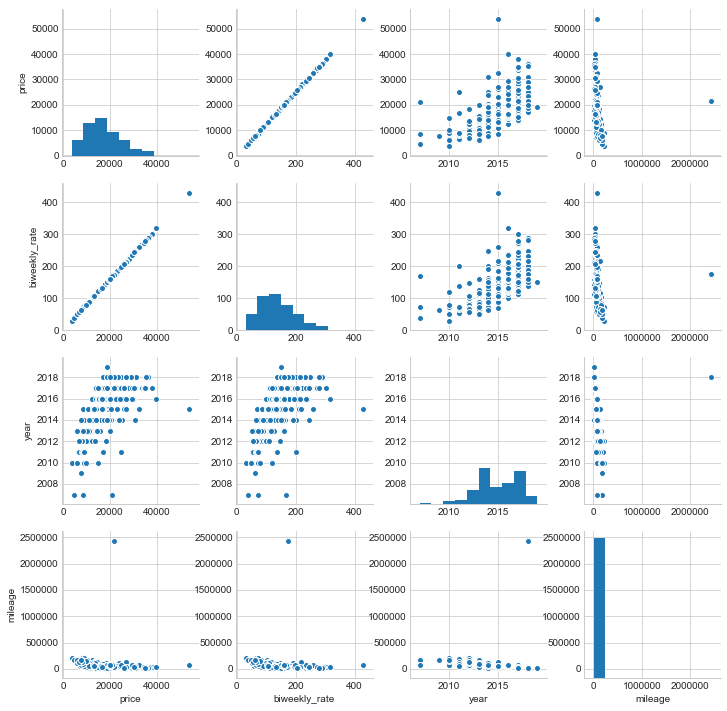
sb.pairplot(df)
<seaborn.axisgrid.PairGrid at 0x1a20f74f28>
df.boxplot(column='price', by='year')
<matplotlib.axes._subplots.AxesSubplot at 0x1a221bb470>
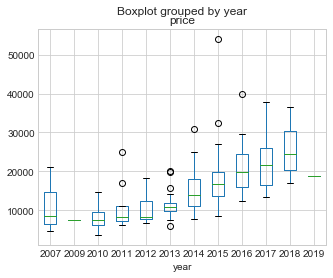
df['price'].max()
53990.0